There are many paths to reach 100% emissions free electricity. We will probably be taking all of them as we build out our nation’s energy future.
The U.S. Department of Energy’s National Renewable Energy Laboratory (NREL) has released Examining Supply-Side Options to Achieve 100% Clean Electricity by 2035. The analysis takes a deep dive into multiple scenarios which all include getting to 100% emission free electricity in under 15 years.
NREL concludes that a 90% clean grid will have a low incremental cost, and that it can be built primarily with new wind, solar, storage, transmission, and other existing technologies. However, the last 10% will present financial challenges, requiring research and new technologies.
The lab points to four ‘critical hurdles’ to reach 100%:
- Dramatic acceleration of electrification and increased efficiency in demand.
- New energy infrastructure installed rapidly throughout the country
- Expanded clean energy manufacturing and supply chains
- Continued research, development, demonstration, and deployment support to bring emerging technologies to the market (the last 10% challenge)
Across all of their main scenarios, the lowest cost electricity mix is dominated by wind and solar, which provide most of the generation (60% to 80%). By the end of this decade, solar will require additions of 40 GWac to 90 GWac per year, and wind will require additions of 70 GW to150 GW per year. By 2035, we will need to have added 2 TW of wind and solar combined.

Other accomplishments that must also happen by 2035 include the deployment of 5 to 8 GWs of new hydropower, 3 to 5 GWs of geothermal, and 120 to 350 GW of Diurnal storage (2 to 12 hours of capacity). Hitting these targets will require $330 to $740 billion in overall capital.
Another complex issue is that the models require between 1,400 and 10,100 miles of new high-capacity lines each year, which NREL says will triple the deployment volume rate being installed today.
Solar in the United States will need to massively increase deployment, with installation rates 2 to 8 times that of the 15 GWac capacity that was added in 2020. These future annual installation volumes will be 25% to 110% of the entire capacity installed worldwide in 2020.

NREL sees that 190 GWac of rooftop installations will need to be installed by 2035, with the overall capacity ranging from 540 GWac to 1 TWac. The research group expects pricing to decline between 14-44% by 2030. In 2035, somewhere between 20 to 36% of all electricity will come from solar.
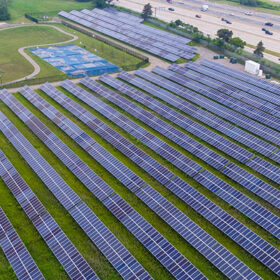
The report suggests that up to 3 million of the nation’s 9.8 million km2 are viable for solar development. If we assume that each MWac of solar power needs 7 acres, then 1 TW of solar would require roughly 6 million acres, or 28,372 km2. That is approximately 3/10th of a percent of the USA’s total land area.
One interesting nuance in the modeling is that a significant amount of existing fossil capacity could be left in place to guard against peaking events. Even though the old infrastructure would rarely be used, generating only 4% of the grid’s electricity each year, the peaking protection would represent a substantial 21% of total capacity. NREL estimates that only 4% of the grid’s generated electricity would come from the old plants. The hope is that by then, we should have a viable carbon capture and storage industry.

The above chart, Figure 19, shows an example scenario and the amounts of capacity (left) versus generation (right).
This content is protected by copyright and may not be reused. If you want to cooperate with us and would like to reuse some of our content, please contact: editors@pv-magazine.com.


I want to understand why deployment of new hydropower is included. It is clearly not economic dispatch that is being used here. I appreciate this paper, and hope it gets a lot of views, but one-way communication seems to be next to useless in creating change, and I am looking for new places where discussions can happen. Any ideas?